Preliminary results from researcing the top 100 New Adult novels, syndicated from @kiazishiru
This syndicated post is sponsored by the following book. The original post can be found here.
 |
| Cover links to Amazon.com |
As preparation for my new novel I decided to break down some elements from popular New Adult novels on Amazon. For this I looked at the top 100 novels under Romance -> New Adult & College. A couple of days ago I had done a shorter and less extensive version of this with only the top 20, but yesterday I pulled the whole top 100. These are my results.
Method:
I opened the full list of the top 100 best selling New Adult books on Amazon in one go so that I would get the whole list without any changes. The problem with this is that it took me a couple of hours (about 3 or 4 or so) to get through the whole list, so, while the books are in their real order for the top 100 list at the moment I started collecting the data, there might have been a few changes that went through while I was working on it (since I only opened 20 books at a time). I am aware of the pitfalls of this method but I choose to ignore this while looking at the data since it won’t make much of a difference over all.
One thing that I have chosen to ignore is that the amount of pages in a book depends on the size of the book itself, its layout and the font type. Also, not all books have print versions, so I chose to follow Amazon’s estimated amount of pages in any calculations I made. For moments where I work with number of words per X, I use the industry standard of 250 words per page. I chose to do this even though not all pages will have an equal amount of words on them and things like front and back matter can differ immensely. This is purely for the ease of calculation and comparison.
Data:
I collected 14 different sets of data with a total of 100 pieces each:
- # on the list (1-100)
- # on the list on the whole Amazon kindle store
- name (with link)
- book or box set
- if it’s part of a series
- price (this might not be the actual US price since I’m in the Netherlands and sometimes get different prices)
- publication date
- amount of reviews
- average review rating
- print size dimensions
- number of pages
- real or estimated pages
- amount of chapters in the book
- Point of View (1st, 2nd or 3rd)
Preliminary results:
These are just some preliminary results. I have a lot more that I’m working on but I found some of these very interesting without going into deeper work.
Store ranking
The #1 on the New Adult list is #21 in the over all Amazon Kindle store and the #100 is #1017 on the over all Amazon Kindle store. This didn’t surprise me, but I found it interesting how the top 100 is evenly distributed over the whole top 1000 in the over all ranking.
Books vs box sets
There are 94 books and 6 box sets.
For some data I exclude box sets because they do not add anything to these comparisons, the data that the box sets are not included in are: print size (none of them had a print version), pages (they are multiple books, so this would only muddle the results), real/estimated pages (they don’t count for pages), chapters (they are not listed) and POV (since they have multiple books, there is no way to find if each book is the same POV).
Series vs stand alone
70 books were part of a series and 30 weren’t.
Among those 30 were all 6 of the box sets and there is one series with 10-12 books in the top 100, so that might skew the result some, though this series has books on the list that have been there 7+ months.
Point of View
Of the 94 books I looked at (all the books but excluding the box sets) 89 were written in 1st person POV and 5 were written in 3rd person POV. This is pretty much a YES on writing in 1st person for New Adult. I didn’t look at present tense vs past tense, this might be a good idea for a next research project.
So, these were the really simple results, for the next part I’m going to have to explain a few terms first, as they require some maths. But to make up for that I’ll also add a couple of pretty graphs with them, so don’t be afraid.
Average = you know this one, add all the numbers and divide the total by the amount of numbers. This one most people usually know.Median = the middle number on the list. When you put all the numbers in order from small to big, this is the number that is the one in the middle of the list (or in the case of an even amount of numbers, you calculate the number between the two middle ones).Modal = the number that has the highest frequency. So you have the most of this number.The reason that I calculated all 3 of them is because they tell you something about the range of the data you’re working with. When they are all (almost) the same you have a symmetric distribution of your data. If they are not the same you can look at the data more closely to see why this is the case.Each of the methods has their own problems. The average can be skewed by a number that is way higher or lower than the rest, influencing the average. The median can be influenced in the same way, if the results seem to be mostly split in two groups the median can suddenly jump to a different number when an extra result is added somewhere else. The modal is influenced when you have a lot of results that have almost (or even exactly) similar amount of frequency and a result is added, that way the modal can jump to a totally different spot.I chose to use all 3 of them because together they give a more complete image of the data that I’m showing you.
That was the theoretical part. You can of course look at the data yourself and see what I mean with them adding extra value to the data. I’ll look at 3 things for now: price, print size and amount of pages.
Price
The prices don’t seem to be too skewed, they are quite strong in preference.
Here are the top 3 price points.
1. $2.99
2. $3.99
3. $0.99
Average: $3.12
Median: $2.99
Modal: $2.99
The average is higher than the median and the modal, this is because of two very expensive books on the list: one is $8.99 and the other $9.99. If you take those two out the average also drops to $2.99. (This is an example why it’s handy to calculate all 3, it can show you outliers that influence your average in weird ways)
Here is a break down of the actual numbers, both in a graph and a table.
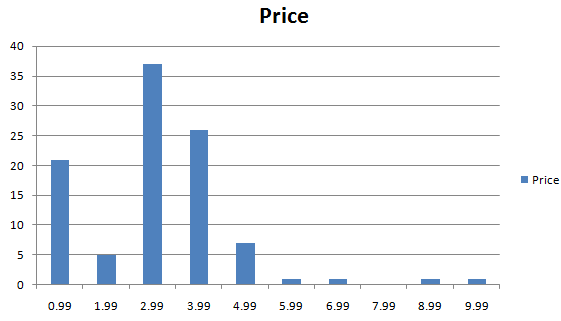
| 0.99 | 1.99 | 2.99 | 3.99 | 4.99 | 5.99 | 6.99 | 7.99 | 8.99 | 9.99 |
| 21 | 5 | 37 | 26 | 7 | 1 | 1 | 0 | 1 | 1 |
I’m absolutely not surprised by these numbers. $2.99 is the price point where authors get the higher royalty rate, so it is very popular(you need to sell 6 books at $0.99 to get the same royalties as one book sold at $2.99). Because of this the $0.99 price point is very popular during sales and other promotional things, they are often temporary prices.
Print size
This is a discussion I’ve had with a lot of other authors in the past, what size to make your print books. This can be a very heated subject to some, while others barely care about it. The results to this were very interesting to me.
One thing to mention up front. 26 of the 100 books I looked at did not have a print version, that includes the 6 box editions. So, this means that 20 (1/5 of the total) regular books didn’t have print versions. This might be interesting to people looking at doing print books or not.
Ignoring the “no print” category it seems that 15 books are 8×5″ and 9 books are 9×6″ in size. All the other books have sizes that aren’t exactly one or the other, this seems to be sometimes an error from Amazon and sometimes the author did choose a specific non-standard size. Because I can’t read the minds of the creators I’m not grouping similar sizes together.
Here is the breakdown of it, in a graph (no table since this is quite a lot of data).

Page count
This is something I was very curious about. I’m personally an author that prefers shorter works and my original trial research seemed to favour the longer sized books. Which sort of made me feel down, but now I’ve got a bigger data pool I’m happy again.
Most of the stories seem to prefer a page count between 200 and 400 pages, with the most in the 300-349 pages count group.
To compare, each page is 250 words (industry standard): so 100 pages is 25,000 words, 200 pages is 50,000 words, 300 pages is 75,000 words and 400 pages is 100,000 words. This makes comparing manuscripts easier for those who are in the process of writing a story.
NOTE: the 100<149 group looks really big, but most of those counts are from just 1 series, which has about 10-12 titles in the top 100, so this skews the data. I’m mentioning this because it looks weird and I can’t predict if that group would be bigger or not if that series wouldn’t be in the top 100.
Here are the graph and the table.
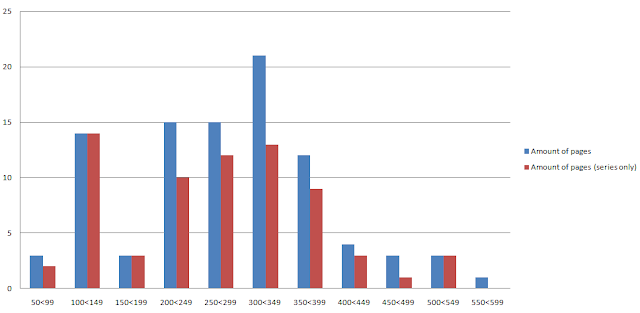
| 50-99 | 100-149 | 150-199 | 200-249 | 250-299 | 300-349 | 350-399 | 400-449 | 450-499 | 500-549 | 550-599 |
| 3 | 14 | 3 | 15 | 15 | 21 | 12 | 4 | 3 | 3 | 1 |
| 2 | 4 | 3 | 10 | 12 | 13 | 9 | 3 | 1 | 3 | 0 |
I chose to compare both amount of pages over all and for books in a series. As you can see, the data isn’t THAT different, though it seems that stand alone books prefer the 300-349 range more than the series books do, even though they are the highest count for both the types.
There are so many things I can do with all this data and I’ve already done some other calculations. But I’m sharing those at some other time. I’ve calculated things like price per 100 pages, amount of reviews per day and how long books have been in the top 100.
There are a lot more things I can calculate and I’m asking you, the public, to help me out. What are some statistics you would like me to show you? Look at the things I’ve collected and it might inspire you.

