Exposure Marketing with The Masquerade Crew
M
arketing on The Masquerade Crew (this site) is all about exposure. I'd love to be able to guarantee a rise in book sales, but unfortunately few can claim that. What I can offer you is exposure, which means more people seeing your book, but the exposure we provide isn't just a one time thing. Our advertising plans extend your exposure over a long period of time.
How much exposure?
Overall site traffic: Since there's more than one way to measure site traffic, I'll try to give you as many numbers as I can. Let's start with Blogger Stats, which are the most inaccurate.
Here's a current snapshot:
- Pageviews today — 1,284*
- Pageviews yesterday — 1,859
- Pageviews last month — 35,457
- Pageviews all time history — 407,815
(Summber 2011 onward)
The most stringent of web analytics is probably from Google. The following numbers are from January 2012 onward.
- Visits — 53,521
- Unique Visitors — 33,747
- Pageviews — 82,220
Incidently, Google says 88% of our visits are from the US, which is why I usually link only to Amazon.com (instead of some of the other Amazons)
A lot of people swear by Google Analytics, but I tend to focus on StatCounter. Yes, the numbers are a little better but not overly so. The following are for the same period as above: January 2012 through today.
- Unique Visitors — 71,793
- Pageviews — 102,815
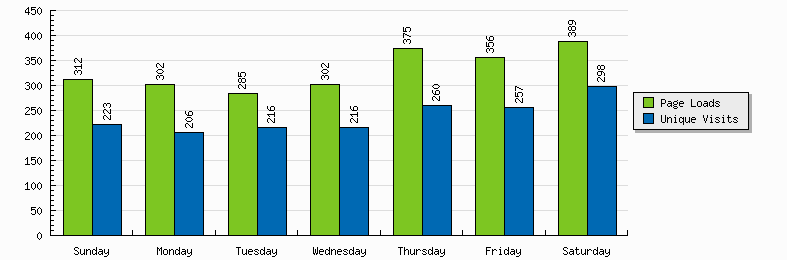
Here's a graph from StatCounter for our traffic this past week.
Our current Alexa ranking is 245,899, but it hovers closer to 200,000 when our daily page view average stays above 300. We had a few slow weeks about a month ago, which explains the rise in rank (which is bad). The lower the number the better.
Post Specific Stats: As far as I can tell, StatCounter doesn't keep visit history for each page more than a day or so. So, I don't usually pay attention to those numbers (since our posts are promoted over a long period of time). I judge popularity of a post on the following.
- How many times it's shared on Twitter via Triberr
- How many times it's shared on Twitter total (Triberr and other)
- From Triberr shares, how many clicks from Twitter
- Blogger page views (for post comparison)
Case Study: Here are the stats for this post.
- Twitter Shares via Triberr: 118
- Clicks from Triberr Shares: 148
- Total Twitter Shares: 192
- Blogger Page Views: 387
It's Triberr run is just about done, though a few more shares and clicks could come through. This was a very good promo run. Not all posts do this well. It all depends on the title of the post, and I always try to pick a title to entice readers. Other times, though, my hands are tied. There may be few reviews on Amazon, the synopsis and/or excerpt is boring or at least doesn't provide any useful enticements, or there's an off day on Twitter and/or Triberr. I'll discuss this dilemma in a future post.
I'm happy with a Triberr run if a promo post gets anywhere from 50 to 75 clicks, and most hit that range. Improving my post titles has increased those numbers over time, and I'll try to get better as time goes on. Our tweet marketing improves post exposure, which I will detail further in another post.
387 page views according to Blogger is a respectable number, though many promos get more. Of course, the post in question is only 2 days old at the time of writing this post. It's final page view count is anyone's guess. Scrolling through Blogger I see a lot of 400's and 500's.

